Warning: Trying to access array offset on value of type bool in /home/predictivesucces/public_html/wp-content/themes/Avada/includes/lib/inc/class-fusion-images.php on line 211
Warning: Trying to access array offset on value of type bool in /home/predictivesucces/public_html/wp-content/themes/Avada/includes/lib/inc/class-fusion-images.php on line 211
5 Ways the Predictive Index Software can make every HR Professional’s Life Easier
By Admin |
1.5 min read
5 Ways the Predictive Index Software can make your Life Easer
All talent and culture issues are handled by the human resources department of every company. Yet most decisions made, are based off empirical information, This makes the decision-making process incredibly frustrating with uncertain outcomes.
When companies know how to leverage analytics in their process, it becomes more actionable and impactful. Here are five ways the Predictive Index, by Certified Partner Predictive Success can help drive your organization towards success.
1. Reference Profiles:
After a thorough analysis of millions of Behavioural Assessments, the PI Science and Research Team identified 17 “Reference Profiles” that create a behavioural map for  different types of people. Once you know someone’s Reference Profile, you gain insight into what their defining workplace behaviours are, how to work with them more effectively, and what kind of traps and pitfalls they have a tendency to fall into.
2. Fit-gap analysis:
A side by side analysis of your candidate in relation to the ideal profile for the job allows you to assess if your candidate is a good fit for the role, while considering company culture and team dynamics.

3. Open Invitation Link:
Smart technology allows all your candidates to be filtered into a folder with just one link. It is easy to send, and easy to access, making the candidate experience seamless and efficient.
4. Team Work Style Analysis:
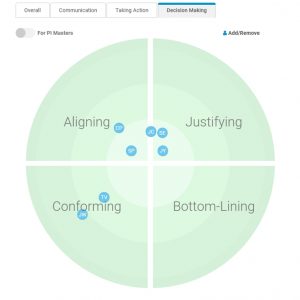
Understand the dynamics of your teams’ overall work style by examining their communication, decision making, and execution insights. By plotting each individual across four quadrants, we can uncover trends and outliers.
5. Group Analytics:
Take a big picture view of your group with analytics to compare their drives and behaviours.
Related Blogs
What Are Leadership Best Practices?
Leadership Best Practices Relating to The Predictive Index: Insights from Predictive Success Effective leadership is the bedrock of any successful organization. Leaders are the visionaries who guide their teams, the decision-makers who drive change, and
What Is The Meaning of Emotional Capacity & How to Best Build It?
What Is the Meaning of Emotional Capacity & How to Best Build It? Emotional capacity is the ability to manage emotions effectively, understand the emotions of others, and remain resilient in the face of stress
Benefits of Using Personality Tests for Hiring
Personality Tests Personality tests have been around for decades, used as a way to screen potential candidates during the interview process. So what's changed? In recent years there has been an increase in more corporations


